13 Sequence Motif Analysis
Finding the Signal in the Noise
Learning Objectives
By the end of this chapter you should be able to:
- Define a sequence motif and explain how motifs differ from domains at both the conceptual and practical level.
- Distinguish between DNA regulatory motifs and protein structural motifs, and provide biological examples of each.
- Explain the mathematical framework of a position-specific scoring matrix (PSSM) and interpret a sequence logo.
- Navigate and apply web-based tools including ExPASy, MotifScan, PRATT, InterProScan, and the MEME Suite to discover and scan for motifs in protein and DNA sequences.
- Construct a computational workflow using FIMO to identify predicted transcription factor binding sites genome-wide.
- Connect motif analysis to inference of regulatory function, extending earlier lessons in homology and functional inference introduced in the previous chapter.
13.1 Introduction
Every cell in your body reads the same genome, yet a neuron behaves nothing like a hepatocyte, and a muscle cell nothing like an immune cell. This remarkable cell-type specificity emerges not from differences in DNA sequence but from differences in how that sequence is read — which genes are turned on, when, and by how much. Buried within the regulatory regions of genes are short stretches of DNA, typically five to twenty base pairs in length, that serve as landing pads for transcription factors and other regulatory proteins. These short conserved sequences are called sequence motifs, and they are among the most fundamental units of biological information.
The concept of a sequence motif extends beyond DNA regulation into the world of proteins. Proteins fold into functional shapes because of the chemical properties of their amino acid sequences, and within those sequences there are recurring short patterns that encode specific structural or biochemical functions — the active site of a kinase, the metal-coordinating residues of a zinc finger, the hydrophobic core of a signal peptide. Whether in DNA or protein, a motif is a short, conserved sequence pattern that carries functional meaning.
This chapter introduces the biology and bioinformatics of sequence motifs. We begin by defining what motifs are and situating them within the broader conceptual landscape of domains, families, and homology introduced in earlier chapters. We then survey the practical computational tools used to discover and search for motifs in both protein and DNA sequences. Finally, we examine a case study from evolutionary genomics — the use of the FIMO tool from the MEME Suite to map predicted binding sites of the PRDM9 protein across great ape genomes — that connects directly to your semester-long project on PRDM9 domain biology.
13.2 What Is a Sequence Motif?
13.2.1 Patterns, Domains, and Motifs
In the previous chapter, you learned that proteins can be described from several perspectives: their family relationships, physical properties, subcellular localization, and functional roles. Central to the discussion of protein families was the concept of the domain — a region of a protein that adopts a particular three-dimensional structure and is shared by multiple proteins, often reflecting common evolutionary origin1. Related to but distinct from the domain is the motif, and understanding the difference between these two concepts is critical.
A domain is a distinct functional, structural, or sequence unit that may exist in a variety of biological contexts; recognizing a domain suggests the presence of a folding unit with predictable function1. A motif, by contrast, is a short conserved region of protein or DNA sequence — typically five to twenty-five residues — that characterizes a functional site or a protein family1. Crucially, shared sequence motifs do not necessarily represent homologs1. Two proteins can share a phosphorylation motif, a zinc-binding motif, or a TATA box because convergent evolution or shared biochemistry favors that particular sequence arrangement, not because the proteins share a common ancestor. This distinction matters for the inferences you can draw: motif analysis allows you to infer specific biochemical activities or regulatory relationships from the presence of a conserved short pattern without necessarily implying the shared ancestry discussed in the alignment chapters.
13.2.2 DNA Regulatory Motifs
When you first encountered gene regulation in introductory biology, you likely learned about the TATA box — the short sequence 5’-TATAAA-3’ found approximately 25 base pairs upstream of the transcription start site of many eukaryotic genes1. This canonical example captures everything essential about a DNA regulatory motif. The TATA box is short, highly conserved across eukaryotes, positioned precisely relative to a functional landmark, and it works by binding a specific protein — the TATA-binding protein (TBP) — that recruits RNA Polymerase II to initiate transcription. When TBP binds the TATA box, it bends the DNA, creating a structural platform onto which the rest of the general transcription machinery assembles1.
The TATA box is a core promoter element, part of the minimal machinery required to position the transcription apparatus at the right place. But gene regulation is considerably more complex than knowing where the polymerase starts. Genes are differentially regulated across cell types, developmental stages, and environmental conditions because of cis-regulatory elements — binding sites for sequence-specific transcription factors that lie upstream, downstream, or even within the genes they regulate. These elements include enhancers, repressors, silencers, and insulator elements, each of which functions because of short DNA motifs recognized by specific transcription factors2. A second illustrative example comes from Initiator (Inr) elements and Downstream Promoter Elements (DPE) in Drosophila melanogaster. The DPE, with a consensus sequence near RGWYV at approximately +28 from the transcription start site, acts cooperatively with the Inr element to recruit the transcription machinery in genes lacking a TATA box2. This reinforces an important principle: not all promoters look the same, and the constellation of motifs in a promoter region encodes a specific regulatory program.
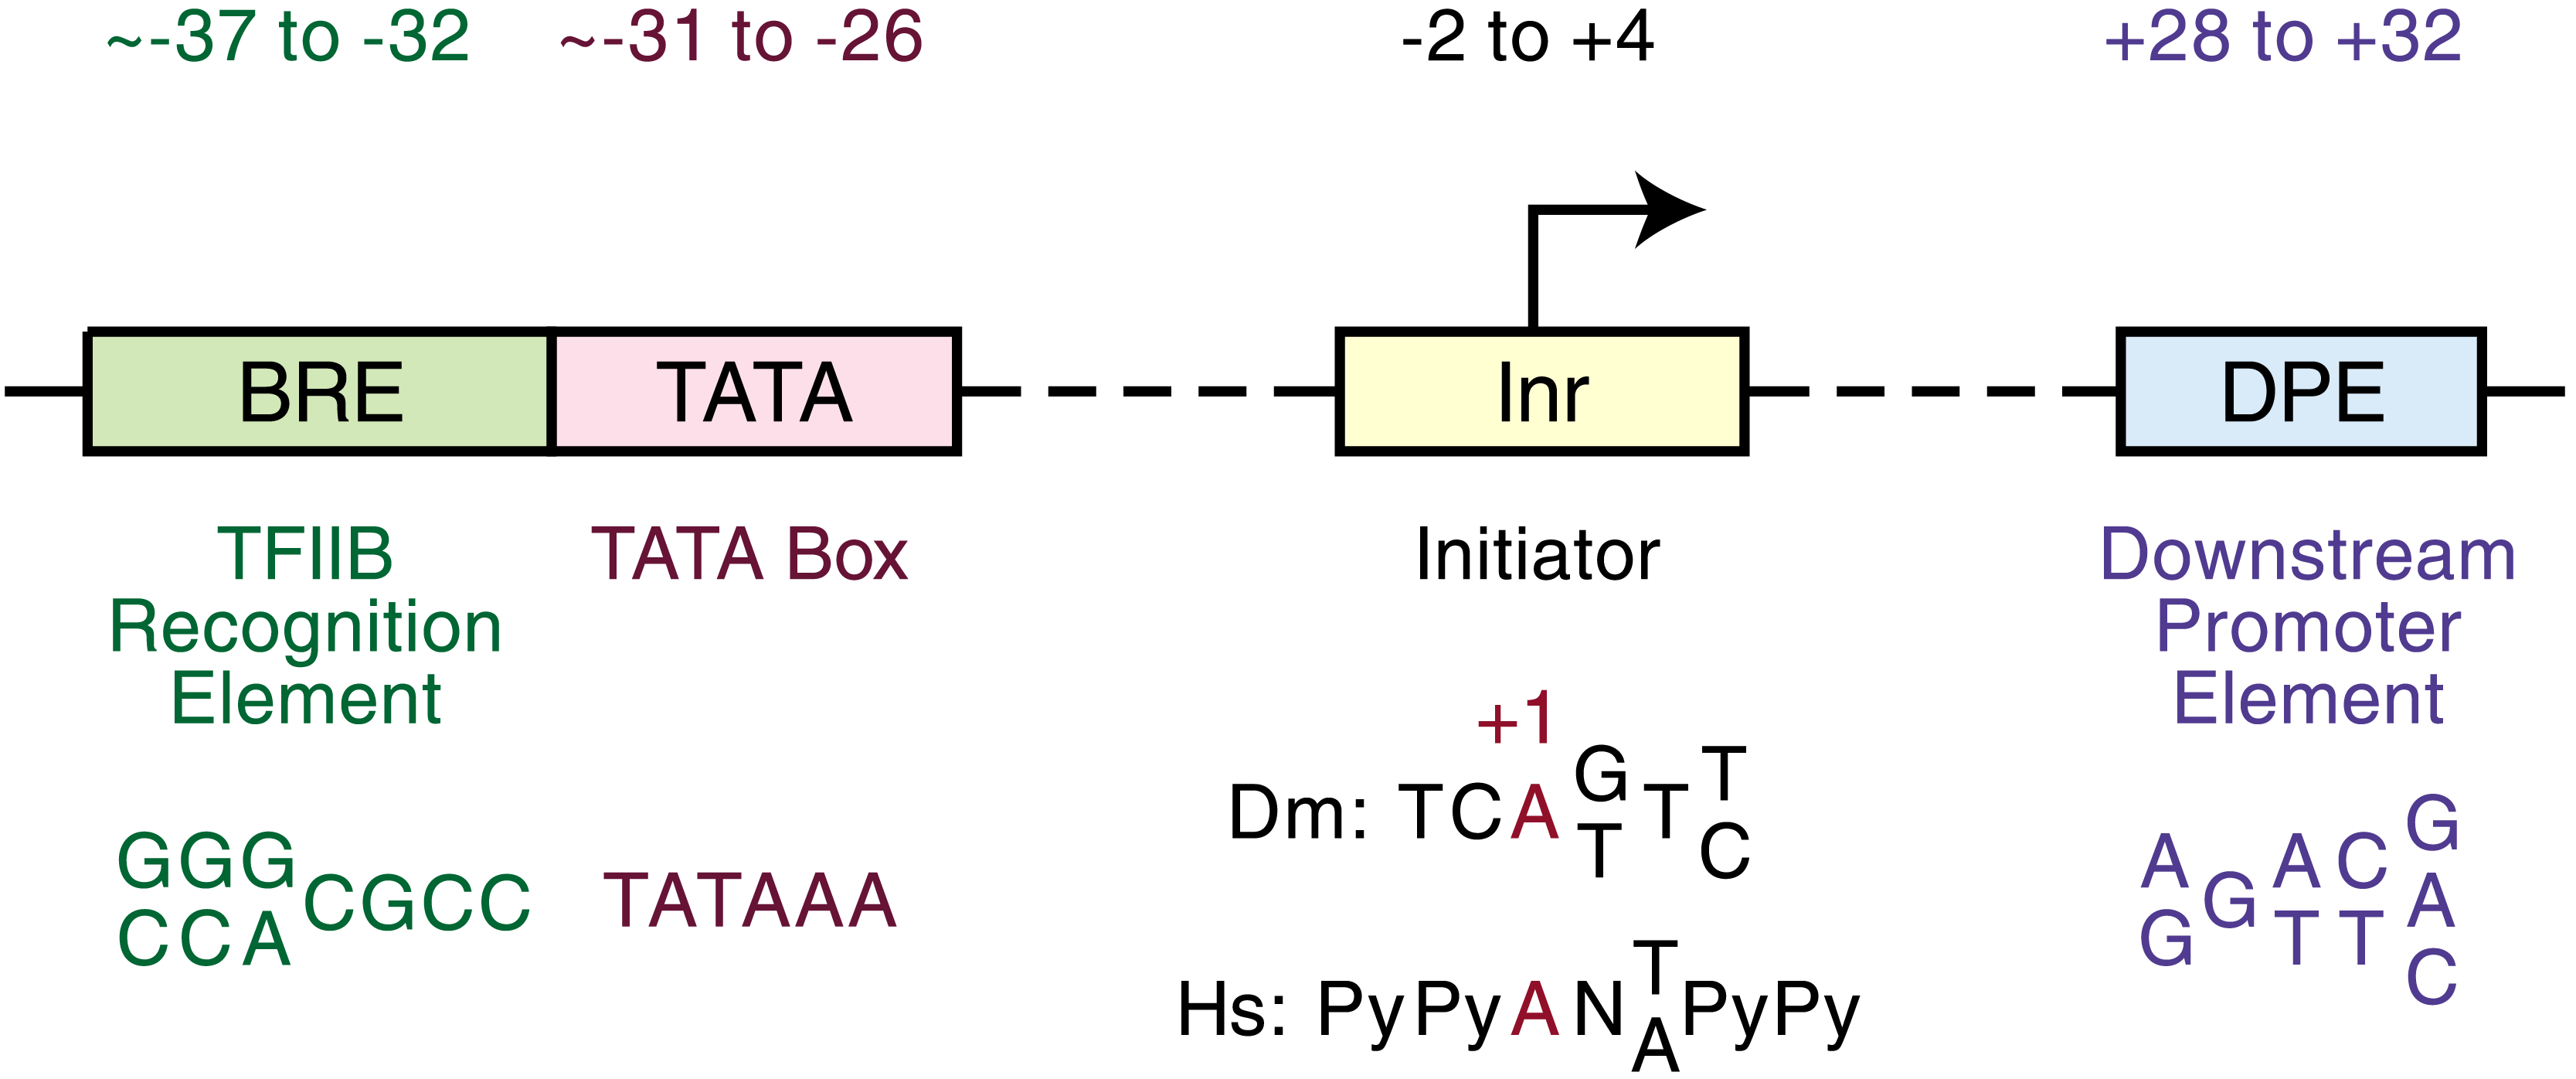
Schematic of the major core promoter elements found in eukaryotic genes, positioned relative to the transcription start site (TSS, position +1). Not all elements are present in every promoter — the TATA box is found in only ~10–15% of human gene promoters — but each represents a short sequence motif recognized by a specific component of the general transcription machinery. The Initiator (Inr) and Downstream Promoter Element (DPE) together support transcription from TATA-less promoters in Drosophila melanogaster and are the basis for the DPE motif example discussed in the text. Image credit: Qef, Wikimedia Commons, released to the public domain.
Transcription factor binding sites are typically tiny — five to twenty-five base pairs — and highly variable depending on the type of transcription factor1. In many regulatory contexts, having more binding sites generally means stronger or more precise regulation, and the relationship between transcription factor concentration, binding site number, and transcriptional output is a major area of current research.
13.2.3 Protein Structural and Functional Motifs
Protein motifs function differently from DNA motifs but share the same fundamental property: short, conserved patterns that carry biochemical meaning. Protein motifs typically encode specific structural configurations, enzymatic active sites, binding interfaces, or post-translational modification sites1.
Consider the kinase motif. Protein kinases phosphorylate target proteins by transferring a phosphate group from ATP to a serine, threonine, or tyrosine residue in their substrates. The substrate recognition sequence — the motif a kinase “reads” in its target — is a short pattern of amino acids surrounding the phosphorylatable residue. For protein kinase A (PKA), the consensus substrate motif is [R/K]-[R/K]-x-[S/T], where S or T is the phosphorylated residue and x is any amino acid1. The presence of this short pattern in a protein provides a specific, testable functional hypothesis without requiring sequence homology to other kinase substrates.
Another instructive example is the zinc finger motif, which you have been exploring through the PRDM9 project. Zinc fingers are small protein motifs that coordinate a zinc ion through conserved cysteine and histidine residues, typically in patterns such as C-x₂-C-x₄-H-x₄-C (the CCHC zinc knuckle of retroviruses) or C₂H₂ (the classical zinc finger of transcription factors)1. The zinc ion imparts structural rigidity to an otherwise flexible polypeptide loop, allowing the protein to make sequence-specific contacts with DNA. C₂H₂ zinc fingers are the most common DNA-binding domain in the human genome, with over 800 proteins encoded by the genome containing this motif — including, as you will see in the case study, the PRDM9 protein that controls meiotic recombination hotspot locations across primates3.
A particularly rich example that bridges protein and DNA motif analysis is the retroviral Gag-pol polyprotein, encoded by HIV-1 (accession NP_057849). This large precursor protein (1,435 amino acids) is cleaved into three proteins with distinct activities: the aspartyl protease, the reverse transcriptase, and the integrase1. Recall from Chapters 5 and 8, that the PROSITE database includes multiple sequence alignments compiled into profile HMMs and is used to identify protein domains. When analyzed at this database, the Gag-pol polyprotein reveals multiple protein patterns and profiles — the zinc knuckle CCHC-type pattern, the reverse transcriptase domain (Pfam 00078), the RNase H domain (Pfam 00075), and the Gag-p24 domain (Pfam 00607)1. HIV-1 Gag-pol therefore illustrates how a single polypeptide can harbor multiple distinct motifs and domains, each contributing a different biochemical function. This multi-domain architecture — which you have seen in the PRDM9 protein (KRAB, SSXRD, PR/SET, and zinc finger array) — is extremely common among regulatory and enzymatic proteins4. At this and other sites, the HMMs can be downloaded to use with the command line software HMMER to identify protein domains as well. This flexibility of tools makes domain identification easy regardless of your skills.
PRDM9 is a striking example of a multi-domain protein in which each domain carries a distinct motif signature. The KRAB domain is a transcriptional repressor module found in many zinc finger proteins. The SSXRD domain contributes to protein-protein interactions. The PR/SET domain is a histone methyltransferase, catalyzing H3K4me3 modifications at hotspot loci. The C-terminal C₂H₂ zinc finger array directly binds DNA in a sequence-specific manner, determining where in the genome recombination hotspots are positioned3,4. As you work through the practical exercises, you will apply the tools discussed in this chapter to the PRDM9 protein and the genomic regions it regulates.
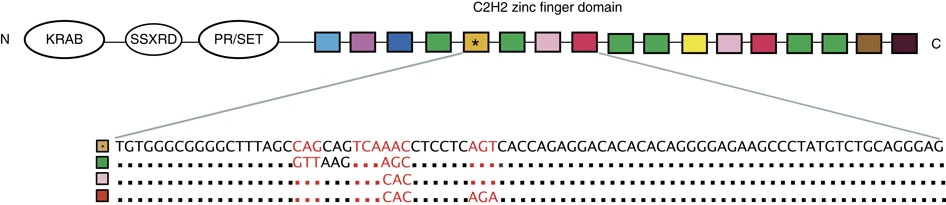
Domain architecture of the human PRDM9 protein. Reading from N- to C-terminus, PRDM9 contains a KRAB domain (which recruits recombination machinery after DNA binding), an SSXRD domain (a short protein-protein interaction module whose precise function remains under investigation), a PR/SET methyltransferase domain (which deposits the activating H3K4me3 mark at hotspot loci), and a large C-terminal array of C₂H₂ zinc fingers (which bind DNA in a sequence-specific manner, determining hotspot placement). This four-domain architecture is a recurring theme in zinc finger transcription factors: the DNA-binding specificity of the zinc finger array can be reprogrammed by rapid evolution while the enzymatic domains remain conserved, enabling a single gene family to generate enormous diversity in gene regulation and recombination control. Figure from Irie et al. (2014) Nature Communications 5:4370, used under CC BY 4.0.
13.2.4 Position-Specific Scoring Matrices and Sequence Logos
Having established what motifs are biologically, we now need to understand how they are represented mathematically — because it is this mathematical representation that powers all the computational tools you will use.
The simplest representation of a DNA or protein motif is a consensus sequence, a string of characters (using IUPAC ambiguity codes for DNA) that summarizes which residue is most common at each position2. The TATA box consensus is 5’-TATAAA-3’ and the Drosophila DPE consensus is RGWYV, where R = purine, W = weak bond, Y = pyrimidine, V = not T. Consensus sequences are easy to read and communicate but discard a great deal of information — they say nothing about how variable each position is or how strongly each possible residue is preferred.
A more powerful representation is the Position-Specific Scoring Matrix (PSSM), sometimes called a position weight matrix (PWM)2. A PSSM is a matrix of scores, one row per position in the motif and one column per possible residue. Each entry is a log-likelihood ratio comparing the probability of observing a particular residue at that position in true motif instances to the background probability of that residue at random. A high score means that residue is strongly favored at that position; a negative score means it is disfavored. To score a candidate sequence against a motif, you sum the scores at each position — higher total scores indicate stronger matches2,5.
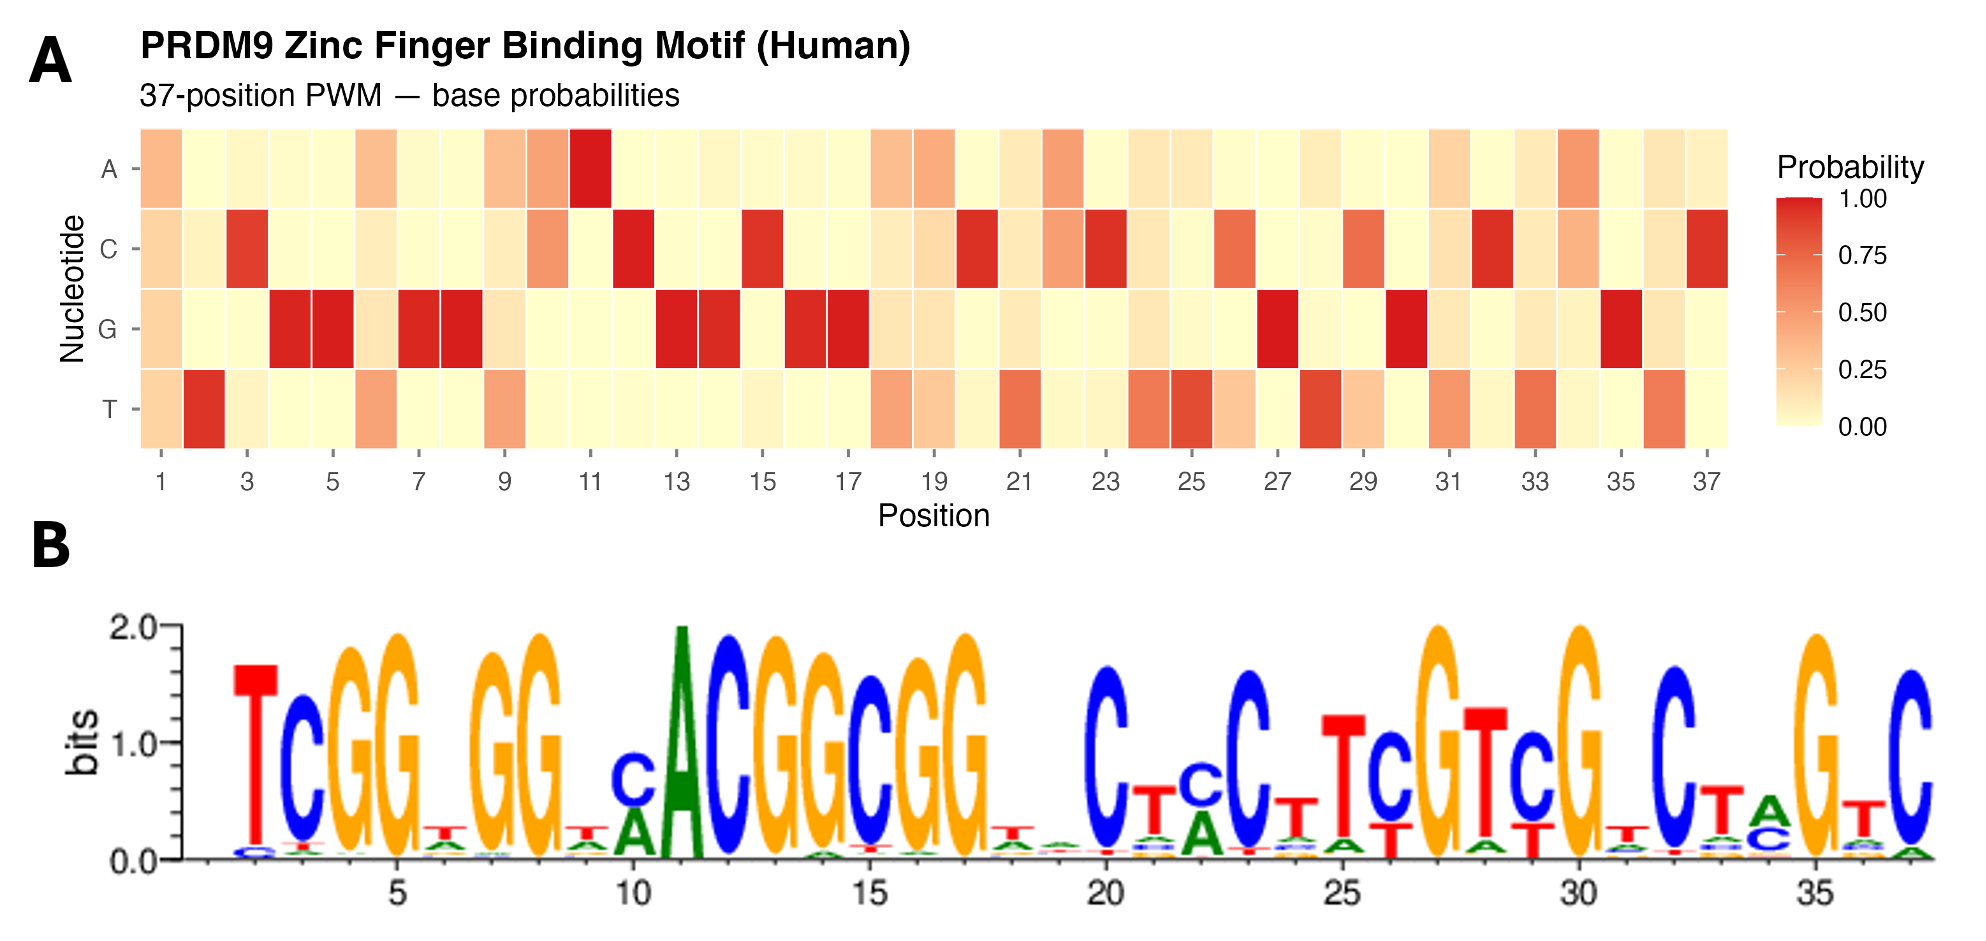
Two complementary representations of the human PRDM9 C₂H₂ zinc finger binding motif, predicted from the protein sequence (NP_001297143.1) using the Interactive PWM Predictor6. (A) A probability heatmap of the predicted position weight matrix (PWM) encodes each cell as a raw probability from 0 (pale yellow) to 1.0 (deep red) — the numerical representation that computational tools such as FIMO use internally when scanning a genome for predicted binding sites5. (B) A sequence logo encodes each position’s conservation as letter height (information content, bits) — the format biologists most commonly encounter when reading the motif analysis literature. Both panels reveal the same biological signal: a repeating pattern of highly conserved positions separated by variable spacers, directly reflecting the tandem arrangement of C₂H₂ zinc finger modules each making sequence-specific contacts with approximately three consecutive base pairs of DNA. Sequence logo generated at https://zf.princeton.edu/; heatmap generated in R from the downloaded PWM.
The intuition behind PSSMs is deepened by considering information content, derived from Shannon entropy. At any position in a motif, if one residue is nearly always observed, the entropy is low and the information content is high — that position is highly conserved. If all residues are equally likely, the entropy is maximal and the information content is zero. The information content at each position is represented visually as the height of a sequence logo, where taller characters represent more conserved positions and the relative heights of letters within a stack represent their relative frequencies2. Sequence logos are the standard visual representation of motifs and you will encounter them in every tool described in this chapter.
Before searching for motifs in a sequence dataset, it is important to consider sequence complexity. Low-complexity regions — runs of the same nucleotide, simple repeats like ATATATATAT — will confound motif finding because they appear frequently by chance. Tools like dust can mask low-complexity sequence before motif analysis, and the MEME Suite includes options to handle repeat masking2,7. This preprocessing step is often overlooked but can be critical for obtaining biologically meaningful results.
13.3 Tools for Motif Analysis
The computational tools for motif analysis fall into two broad categories: those designed for protein sequence motifs and those designed for DNA sequence motifs. In practice, the MEME Suite spans both, but the protein-focused tools of ExPASy, MotifScan, PRATT, and InterProScan remain essential for characterizing individual proteins and large-scale proteome annotation.
13.3.1 Protein Motif Analysis: The ExPASy Ecosystem
The Expert Protein Analysis System (ExPASy) at the Swiss Institute of Bioinformatics (www.expasy.org) serves as a premier portal for protein sequence analysis1. ExPASy integrates a remarkable diversity of tools — from two-dimensional gel databases and mass spectrometry resources to protein domain databases and motif scanning utilities. For motif analysis, the most relevant tools within the ExPASy umbrella are ScanProsite (for searching with PROSITE patterns and profiles) and links to the broader InterPro system1.
PROSITE, maintained at ExPASy, is a database of protein families, domains, functional sites, and associated patterns and profiles. PROSITE entries come in two types: patterns, which are short regular expressions describing conserved amino acid sequences (for example, the zinc knuckle CCHC-type pattern C-x(2)-C-x(4)-H-x(4)-C), and profiles, which are PSSMs that capture statistical variation at each position across aligned motif instances. Profiles are generally more sensitive than patterns because they capture quantitative variation rather than binary matches1. The ScanProsite tool at ExPASy (https://prosite.expasy.org/scanprosite) allows you to paste a protein sequence and identify all PROSITE patterns and profiles that match within it. When applied to HIV-1 Gag-pol, ScanProsite returns eight distinct hits for the zinc finger CCHC-type profile across the zinc knuckle domains, alongside numerous N-myristoylation pattern hits — illustrating both the genuine functional signals and the challenge of distinguishing biologically significant occurrences from false positives1.
MotifScan (https://myhits.sib.swiss/cgi-bin/motif_scan) is a closely related tool within the SIB/ExPASy ecosystem that scans a protein sequence against multiple motif databases simultaneously, returning hits ranked by statistical significance. It serves as a convenient one-stop shop for an initial survey of a protein’s domain and motif content. PRATT (https://www.ebi.ac.uk/Tools/pfa/pratt/) takes a different approach: rather than scanning a single sequence against a fixed database, PRATT discovers de novo patterns shared by a collection of input protein sequences. You provide a set of unaligned protein sequences believed to share a common feature, and PRATT finds the conserved pattern that best describes them — particularly useful when you have a set of proteins with a suspected shared function but no prior knowledge of what the conserved motif looks like.
13.3.2 InterProScan: An Integrated View of Protein Function
InterPro (https://www.ebi.ac.uk/interpro/) represents perhaps the most comprehensive portal for protein domain and motif analysis1. InterPro is not itself a database of motifs but rather an integrated documentation resource that unifies eleven member databases including PROSITE, Pfam, SMART, SUPERFAMILY, PRINTS, TIGRFAMs, and others1. Each InterPro entry provides a description of a protein family, domain, or functional site and integrates evidence from multiple underlying databases — if a protein domain is recognized by Pfam and SMART independently, both lines of evidence appear in the InterPro entry, increasing confidence in the annotation.
The InterProScan tool (https://www.ebi.ac.uk/interpro/search/sequence) allows you to paste a protein sequence and receive a comprehensive annotation covering all recognizable domains, motifs, and functional sites from across the integrated databases. The output is a graphical block diagram in which each domain appears as a colored bar at its position along the protein sequence, alongside Gene Ontology (GO) term annotations linking the protein to biological processes, molecular functions, and cellular components1. For a multi-domain protein like PRDM9, InterProScan returns distinct annotations for the KRAB domain, the SSXRD region, the SET/PR-SET methyltransferase domain, and each individual C₂H₂ zinc finger module — giving a complete architectural overview of the protein in a single analysis4.
13.3.3 The MEME Suite: Motif Discovery and Scanning for DNA and Protein
The MEME Suite (http://meme-suite.org) is the dominant toolkit for sequence motif analysis, equally applicable to DNA, RNA, and protein7. Originally built around the MEME algorithm itself, the suite has grown into an integrated set of tools organized into four functional categories: motif discovery, motif enrichment analysis, motif scanning, and motif comparison. The MEME Suite has been used in over 9,800 published studies and serves nearly 20,000 unique web users per year7.
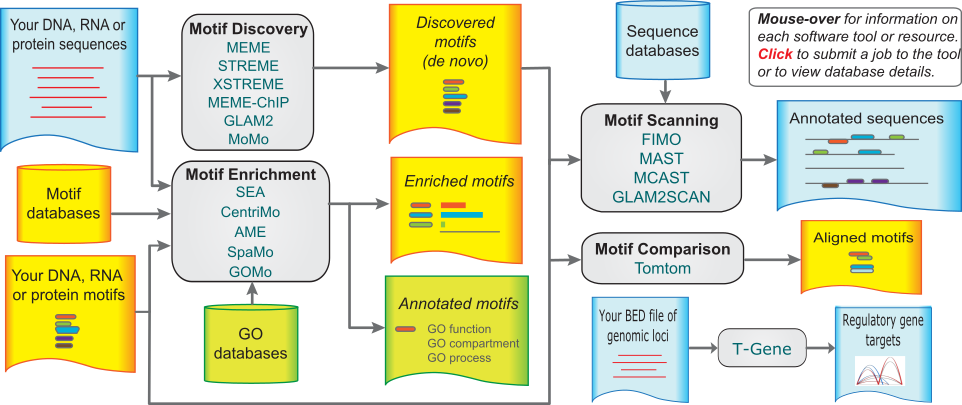
Schematic overview of the MEME Suite webserver, illustrating the four functional categories of tools and the flow of data between them. Motif Discovery tools take sequences as input and return enriched motifs found de novo without prior knowledge. Motif Enrichment tools test known motifs for statistical enrichment in a foreground relative to a background sequence set. Motif Scanning tools — most importantly FIMO for this chapter’s case study — search genome sequences for all occurrences of a specified motif, returning scored, statistically evaluated binding site predictions. Motif Comparison via Tomtom assigns biological identity to newly discovered motifs by comparing them to curated databases. Together, these modules form an integrated pipeline moving from raw sequences to annotated regulatory predictions. Figure from7, Nucleic Acids Research 43:W39–W49, used under Oxford Open Access license.
Motif Discovery tools find patterns de novo in a set of unaligned input sequences. The flagship MEME algorithm (Multiple EM for Motif Elicitation) uses the Expectation-Maximization (EM) algorithm to find the set of motifs that best explains the input sequences under a probabilistic model7. You provide a FASTA file of sequences — for example, the promoter regions of co-expressed genes, ChIP-seq peak regions, or upstream regulatory regions of genes induced by a specific signal — and MEME returns the motifs most enriched in those sequences, each represented as a PSSM and sequence logo7. MEME is a general-purpose discovery algorithm for both nucleotide and peptide motifs. DREME (Discriminative Regular Expression Motif Elicitation) complements MEME by being more sensitive for short nucleotide motifs and by using a discriminative approach that finds motifs enriched in a foreground set relative to a background set. MEME-ChIP is adapted for very large datasets such as ChIP-seq peak sets, running MEME, DREME, and several enrichment analyses in a single integrated pipeline7. GLAM2 extends motif discovery to allow insertions and deletions within the motif, useful for cases where motif instances are not precisely the same length.
Motif Enrichment Analysis tools test known motifs for enrichment in a set of sequences, using databases like JASPAR, which contains experimentally validated transcription factor binding profiles for many organisms. CentriMo is the most sensitive of these tools; it tests whether a known motif is centrally enriched in a set of input sequences, leveraging the fact that ChIP-seq peak sequences typically have the binding motif near the center7. AME (Analysis of Motif Enrichment) tests whether sequences in a foreground set have more occurrences of a motif than a background set. SpaMo looks for preferred spacings between pairs of motifs, revealing transcription factor co-binding preferences.
Motif Scanning tools are used once a motif is known and you want to find all its occurrences in a genome or sequence database. FIMO (Find Individual Motif Occurrences) is the method of choice for genome-wide scanning — it identifies every position in a genome where a motif occurs with a score above a specified threshold, reporting log-likelihood ratio scores, p-values, and false discovery rate-corrected q-values for each predicted binding site5. MAST assigns each sequence in a database a composite score based on how well it matches a set of input motifs, more suitable for scoring short sequences like proteins or candidate regulatory regions7. MCAST scans genomes for clusters of motifs, designed to detect cis-regulatory modules containing binding sites for multiple cooperating transcription factors.
Motif Comparison is handled by Tomtom, which compares user-supplied motifs against a database of known motifs to determine whether a newly discovered motif matches any previously characterized binding specificity7. Tomtom aligns each input motif against each database motif and reports statistically significant matches — an indispensable tool for assigning biological identity to de novo discovered motifs.
A key strength of the MEME Suite is its consistent reporting of statistical significance for all outputs, distinguishing it from many alternative tools7. FIMO reports both p-values (computed from the PSSM using dynamic programming, assuming a zero-order background model) and q-values (false discovery rate estimates computed via a bootstrap method)5. Because genomes are large and motifs are short, scanning a genome will inevitably produce many matches, some spurious. The q-value tells you the expected proportion of false positives among all hits above a given threshold. A standard cutoff of q < 0.05 means that among all predicted binding sites, fewer than 5% are expected to be false positives — a meaningful statistical guarantee when scanning billions of base pairs.
13.4 Practical Workflows
13.4.1 Characterizing a Multi-Domain Protein with ExPASy and InterProScan
The most direct application of protein motif analysis is the characterization of an unknown or poorly annotated protein sequence. The general workflow begins with obtaining your protein sequence in FASTA format from NCBI Protein or UniProt, then submitting it to complementary tools. InterProScan provides the broadest domain and motif coverage by integrating multiple databases simultaneously1. ScanProsite provides detailed PROSITE-specific information, particularly useful for identifying functional site patterns — phosphorylation sites, glycosylation sites, signal peptides — in addition to domains1. Together, these tools provide a rich functional portrait of any protein in a matter of minutes, often revealing functional features that would otherwise require weeks of literature review.
Consider the practical case of HIV-1 Gag-pol (NP_057849.4), a 1,435 amino acid polyprotein. Submitting this sequence to InterProScan returns a multi-domain architecture spanning the GAG p24 capsid core domain, multiple CCHC zinc knuckle motifs, the aspartyl protease domain, the reverse transcriptase domain, and the integrase domain1. The same sequence submitted to ScanProsite reveals eight zinc finger CCHC-type profile hits alongside numerous N-myristoylation pattern hits — a reminder that not all pattern matches are biologically meaningful; some motif patterns are common enough that they appear frequently by chance in long sequences, and biological relevance must always be considered in context1.
13.4.2 Discovering Transcription Factor Binding Sites with MEME
The canonical MEME workflow begins with a set of DNA sequences believed to share a regulatory relationship. The most common starting point in the genomics era is a set of ChIP-seq peak sequences — the genomic regions where a specific transcription factor has been shown to bind. After downloading peak coordinates and extracting the corresponding DNA sequences (typically 500 bp windows centered on each peak), you submit the FASTA file to MEME with the “zero or one occurrence per sequence” (zoops) model, appropriate when you expect at most one instance of the motif in each peak region7.
MEME returns the top enriched motifs as sequence logos alongside statistical information including the number of sequences containing the motif, its E-value, and the information content of each position. The most significant motif recovered from a transcription factor ChIP-seq experiment should, if the experiment was successful, correspond to the known binding specificity of the immunoprecipitated factor. You can verify this by submitting the discovered motif to Tomtom and comparing it against the JASPAR database — if the top Tomtom hit is the factor you studied, you have computational confirmation that the ChIP-seq experiment recovered the correct signal7. After motif discovery, CentriMo analysis provides an important secondary validation: a motif that shows strong central enrichment in ChIP-seq peak sequences is far more likely to be the causal binding motif than one that appears uniformly distributed across the peak regions.
13.4.3 Genome-Wide Binding Site Prediction with FIMO
Once a motif is established — whether from de novo discovery, literature, or a database — FIMO enables you to scan the entire genome to find every location where that motif occurs above a statistical threshold5. For each position in the input genome sequence, FIMO computes the log-likelihood ratio score of the motif at that position and converts it to a p-value. After scanning the entire genome, false discovery rate correction is applied, and FIMO outputs a ranked list of predicted binding sites with their genomic coordinates, scores, and q-values5. The output of FIMO can be uploaded to the UCSC Genome Browser as a custom track, allowing you to visualize predicted binding sites in their genomic context alongside gene structures, conservation scores, ChIP-seq data, and regulatory element annotations. In terms of performance, FIMO can scan DNA sequences at approximately 3.5 megabases per second on a single CPU5, meaning that scanning the human genome takes on the order of minutes to tens of minutes. FIMO output is available in HTML, XML (CisML format), plain text, and GFF/WIG files suitable for genome browsers5.
13.4.4 Case Study: PRDM9 Binding Sites Across Great Ape Genomes
PRDM9 controls the location of meiotic recombination hotspots by binding specific DNA sequences through its C₂H₂ zinc finger array, depositing H3K4me3 marks that recruit the double-strand break machinery4. Prior work had reported it being important in humans and mice, but it was unclear if that importance extended beyond these model systems. A major study in chimpazees reported that “the hotspot-specifying protein PRDM9 shows extensive variation among Western chimpanzees, and there is little evidence that any sequence motifs are enriched in hotspots” — leaving open the question of whether PRDM9-driven hotspot localization was a general feature of great apes or specific to humans and mice.8 reframed this as an explicit hypothesis test: if PRDM9 broadly promotes recombination by binding target sequences, then predicted binding sites (PBS) derived from each species’ PRDM9 allele should be systematically enriched at hotspots relative to matched coldspots.
Three testable predictions. This hypothesis generates a logical hierarchy of predictions that motif analysis can directly evaluate. First, hotspot regions should contain more PBS than coldspots — tested by comparing both the proportion of regions with at least one PBS and the absolute PBS count per region. Second, PBS should be spatially concentrated near hotspot centers, not distributed uniformly — tested by examining the positional distribution of FIMO hits within the 2 kb windows. Third, hotter hotspots should harbor more PBS than cooler ones, while their matched coldspots should show no such trend — tested by correlating PBS count with estimated recombination rate.
FIMO workflow. Hotspots and matched coldspots were identified from whole-genome sequence data of Nigerian and Western chimpanzees, bonobos, and gorillas from the Great Ape Genome Project8,9 using a novel recombination hotspot detection approach10. The binding specificity of each species’ PRDM9 allele was encoded as a PWM (see Figure 13.3) and FIMO scanned each 2 kb region, applying FDR correction to yield scored PBS with q-values5.
Results. All three predictions were supported across humans, gorillas, and bonobos — but not in chimpanzees, which showed varying results under the three different tests for the Nigerian chimpanzee and no significant results for the Western chimpanzee, consistent with the prior study. The most likely explanation is that extensive PRDM9 allelic diversity in Western chimpanzees produces a composite recombination landscape in the population-level LD data, effectively blurring the signal; finer-scale, shorter-timescale estimates would likely recover it. The chimpanzee exception is itself instructive: a null result does not necessarily mean the biology is absent, but may instead reflect a limitation of the measurement approach.
This case study demonstrates how translating a biological hypothesis into a set of ordered, falsifiable motif-based predictions — enrichment, spatial centrality, and dose-response — produces a much stronger argument than a single enrichment test alone.
13.5 Problem Sets
- Protein Motif Scanning with ExPASy and InterProScan: Navigate to NCBI Protein and retrieve the sequence for HIV-1 Gag-pol (NP_057849.4) in FASTA format.
- Submit this sequence to InterProScan (https://www.ebi.ac.uk/interpro/search/sequence). How many distinct domains are identified? Create a table listing each domain, its database of origin (Pfam, SMART, PROSITE, etc.), its position in the protein, and its inferred function.
- Submit the same sequence to ScanProsite at ExPASy (https://prosite.expasy.org/scanprosite). Compare the results to InterProScan. Which tool identified more functional sites? Which types of annotations are unique to each tool?
- Which tool do you find more useful for understanding this protein, and why?
- Exploring PRDM9 Domain Architecture: Here, use either the manually annotated PRDM9 protein sequence you generated earlier in the semester or retrieve the human PRDM9 protein sequence using NCBI Protein or BioMart as described in earlier chapters.
- Submit the sequence to InterProScan and identify the four major domains: KRAB, SSXRD, PR/SET (methyltransferase), and C₂H₂ zinc fingers. Record the position of each domain.
- For each domain, write two to three sentences describing its known biological function based on InterPro GO term annotations.
- Based on the zinc finger array alone, what would you predict about PRDM9’s molecular function if you had no prior knowledge of its role in meiosis? What does this exercise reveal about the power and limits of domain-based functional inference?
- Discovering a Motif with MEME: Go to the MEME Suite web server (http://meme-suite.org) and access the MEME tool.
- Create a set of five to ten short DNA sequences (15–30 bp each) that all contain a shared motif of your own invention — an 8–12 bp sequence — embedded at random positions within longer flanking sequence. Submit these to MEME with the “zero or one occurrence per sequence” model. Does MEME recover your motif? Examine the E-value and information content.
- Submit your discovered motif to Tomtom and compare it against the JASPAR vertebrates database. Does your invented motif resemble any known transcription factor binding site? What would it mean biologically if it did?
- TFBS Activity — Web Activity: Make up your own transcription factor binding site or generic cis-element (5–20 bp, any combination). Enter it into Tomtom (http://meme-suite.org/tools/tomtom) to check whether your regulatory motif resembles any actual binding site.
- Report your motif, any significant hits, and whether the result makes biological sense.
- What does this exercise reveal about the degeneracy and functional diversity of transcription factor binding sites?
- Mini-Replication of the PRDM9 Binding Site Analysis: Visit the JASPAR database (https://jaspar.genereg.net) and download the PWM for a human transcription factor of your choice in MEME format.
- From a published ChIP-seq dataset for your chosen factor (available through ENCODE at https://www.encodeproject.org), download the top 200 peak regions and define 200 matched background regions (similar GC content, no ChIP-seq signal).
- Using FIMO, scan both sets of regions for predicted binding sites. Compare the proportion of foreground versus background regions containing at least one predicted binding site. Is the difference statistically significant?
- In one paragraph, interpret your result in the context of what we know about the relationship between PSSM-based binding site prediction and experimental evidence of transcription factor binding.
13.6 Reflection Questions
Motifs versus homology. In earlier chapters, you learned to infer shared function from homology — the logic that two proteins sharing an ancestor likely share function. Motif analysis offers a different mode of inference: finding a motif in a protein implies a specific biochemical activity regardless of the protein’s evolutionary history. Construct a biological scenario in which these two modes of inference would give contradictory predictions about a protein’s function. How would you resolve the contradiction? What does your answer reveal about the limits of inference from sequence alone?
The evolutionary arms race at PRDM9. PRDM9’s zinc finger array evolves under strong positive selection — one of the fastest-evolving regions in the primate genome3. From an evolutionary perspective, why might positive selection favor continuous diversification of PRDM9 binding specificity? Consider what would happen over evolutionary time if PRDM9 always bound the same sites — what would accumulate at those sites, and how might that affect fitness? Connect your answer to the concept of hotspot erosion and the dynamics of rapidly evolving recombination landscapes.
The gap between prediction and biology. FIMO predicted thousands of PRDM9 binding sites across each great ape genome, but only a small fraction of these sites function as recombination hotspots8. List at least three distinct biological mechanisms — not computational reasons — that could cause a predicted binding site to be inactive in vivo. For each, describe an experimental approach that could test your hypothesis.
Connecting all four PRDM9 domains. Based on what you have learned in this chapter and in your semester project, write a paragraph describing how all four domains of PRDM9 work together — mechanistically and spatially — to execute the protein’s biological function at a recombination hotspot. Which domain is most amenable to motif-based analysis, and which would require structural data for a complete functional understanding?
Cross-chapter connections. ChIP-seq data provided the empirical hotspot maps used in the PRDM9 case study, and you explored the ChIP-seq workflow in an earlier chapter. How does the motif analysis performed with FIMO complement the information provided directly by ChIP-seq? What additional questions can FIMO address that ChIP-seq alone cannot answer, and vice versa?